Dot Diagrams
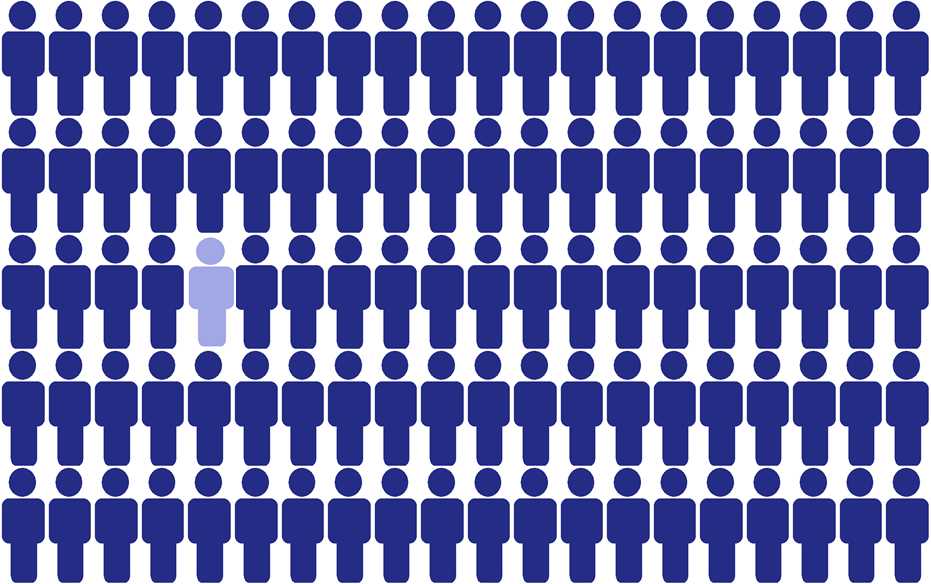
Dot Diagrams show the proportion of people who experience certain side effects of medicines.
We are investigating how colour affects perceptions. The results will be used to create higher quality side effect information and help people to adhere to their medicines. We are all individuals with personal thoughts and beliefs – we want to hear your opinion! The study will take around 5 minutes and can help us to make important improvements across medicines.
Share:
Data Use
Concerned about how your data
will be used? To read our full data
use statement please follow the
link below.
Related links: